Checking Your Stats
The dashboard is the first thing you’ll see after logging in. Monitor your productivity at a glance, compare your stats to the company average (in gray below your own), and see what everyone else is up to.
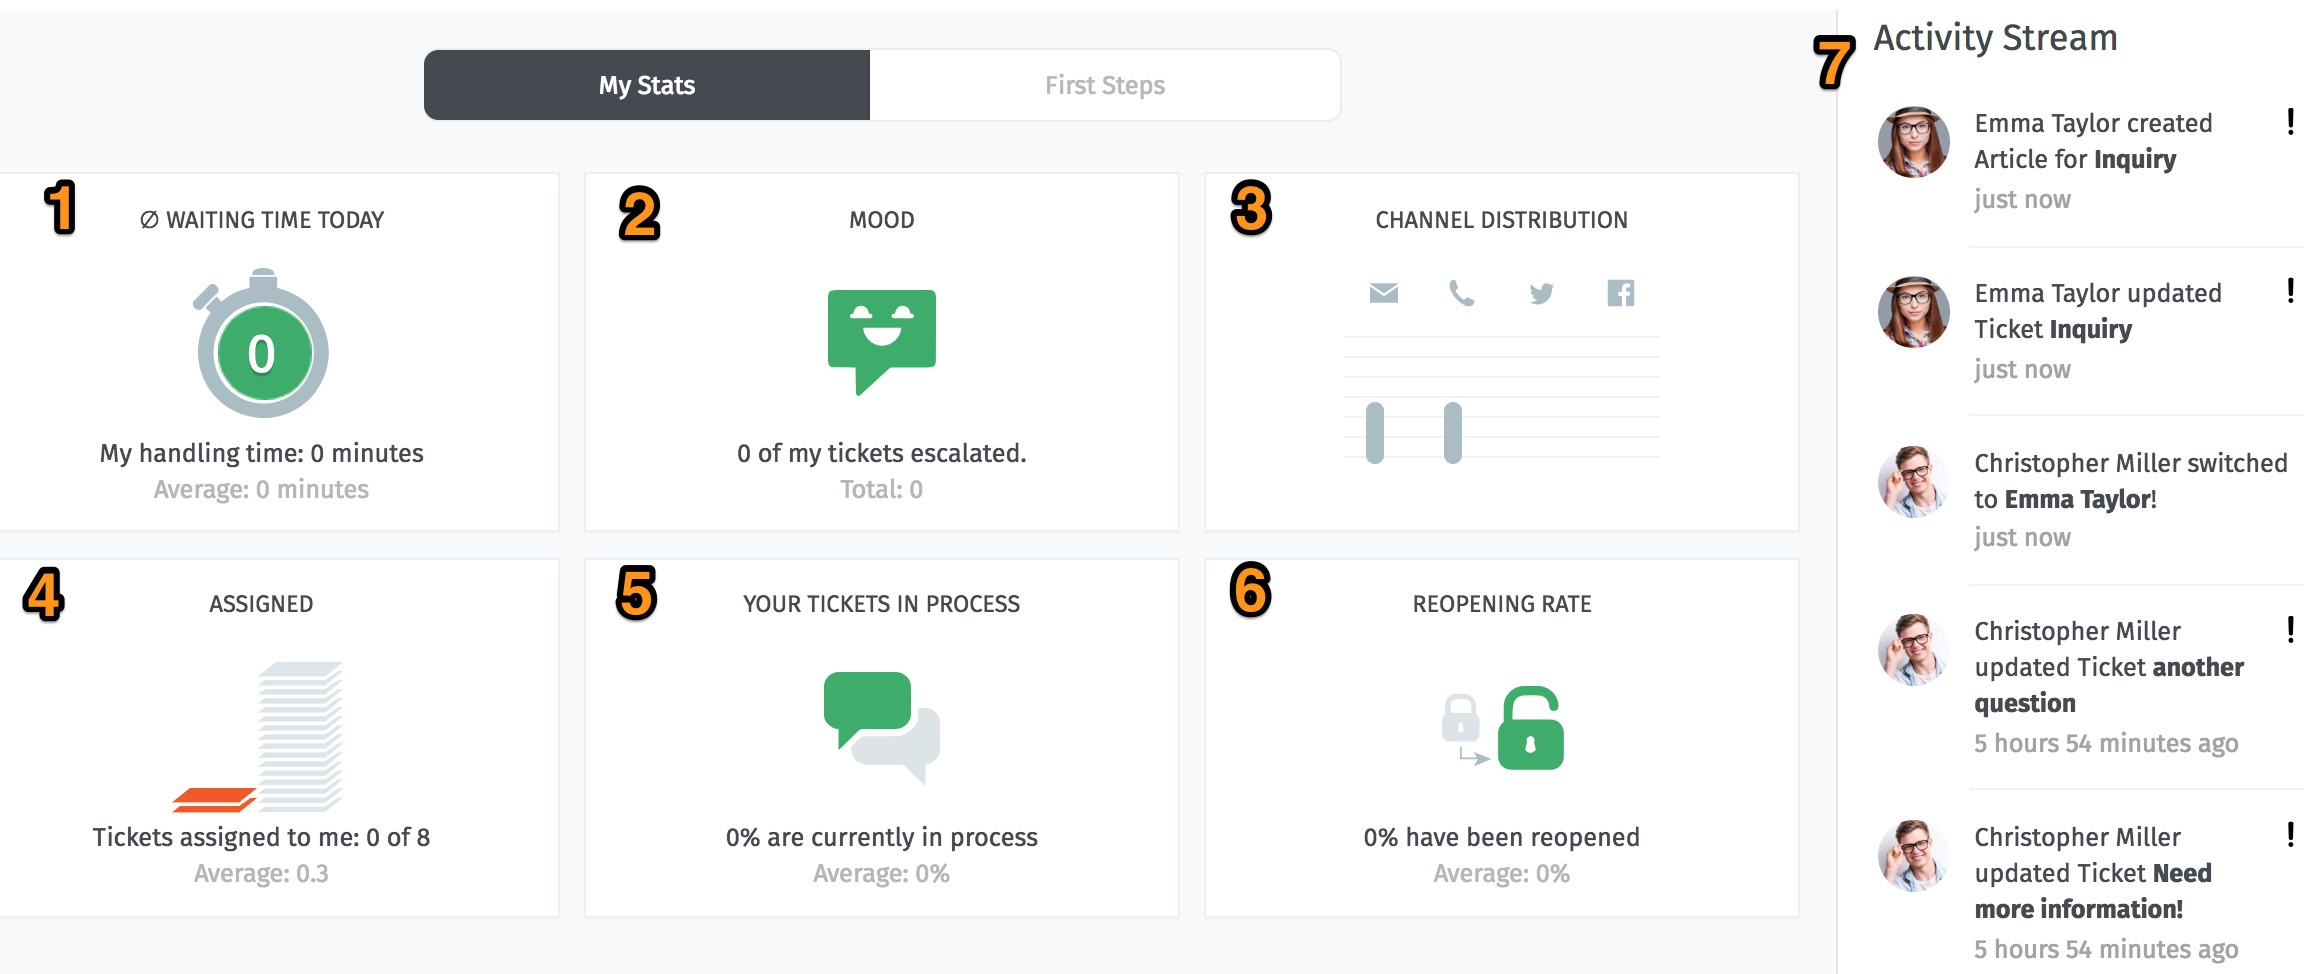
Check the dashboard for a quick summary of your stats (updated every 30 minutes).
| Legend | |
|---|---|
| 1. Waiting Time Today | How long has each customer had to wait, on average, to get a response from you today? |
| 2. Mood | How many escalated tickets do you have open right now? (Mr. Bubbles gets grumpy if you have too many…) |
| 3. Channel Distribution | Where are all your tickets coming from? (Shows tickets created in the last seven days, also sorted by inbound vs. outbound.) |
| 4. Assigned | Out of all open tickets (company-wide), how many are currently assigned to you? |
| 5. Your Tickets in Process | What percentage of your tickets have you responded to or updated in the last 24 hours? |
| 6. Reopening Rate | How many of your closed tickets have been re-opened in the last seven days? |
| 7. Activity Stream | What’s everyone else on your team up to? |